Data Analytics Roadmap
Data analytics has evolved from a supporting function into a strategic business capability that drives organizational decision-making. In 2025-2026, the field is experiencing explosive growth with 23% job growth projected through 2033, significantly outpacing average occupational growth. The discipline is evolving rapidly, characterized by the integration of AI/ML capabilities, shift toward real-time analytics, increasing emphasis on responsible data practices, emergence of new specializations (Product Analytics, Analytics Engineering), and growing importance of soft skills and business acumen alongside technical expertise.
This comprehensive roadmap provides structured guidance for professionals at all career stages—from aspiring analysts to analytics executives—to navigate skill development, tool selection, career progression, and specialization opportunities across diverse global markets, with particular emphasis on India and Asia's rapidly growing analytics ecosystem.
Industry Context & Market Dynamics
Market Growth & Demand
Data analytics roles are experiencing unprecedented demand globally. The U.S. Bureau of Labor Statistics projects 23% job growth for data analysts from 2023-2033, significantly exceeding average occupational growth. The global data analytics market reached over $178 billion in 2025 and continues accelerating as organizations across finance, healthcare, retail, technology, and manufacturing increasingly rely on data-driven decision-making.
Critically, demand extends beyond traditional "Data Analyst" titles. Organizations actively recruit Business Intelligence Analysts, Product Analysts, Financial Analysts, and Analytics Engineers. This specialization reflects organizational recognition that analytics success requires diverse expertise addressing different business problems.
Compensation & Career Opportunity
The 2025-2026 salary landscape reflects strong market demand. Entry-level data analysts earn $60,000-$80,000, while mid-level analysts (3-5 years) command $80,000-$120,000 nationally in the US, with significant premiums in tech hubs. San Francisco and New York offer mid-level salaries of $100,000-$125,000 and $85,000-$105,000 respectively.
Importantly, the career progression offers clear advancement pathways. Analysts can progress to senior roles ($95-140K), management ($130-160K), and executive leadership ($160-200K+) over 10-15 years, with flexible IC vs management track options.
Career Progression Framework
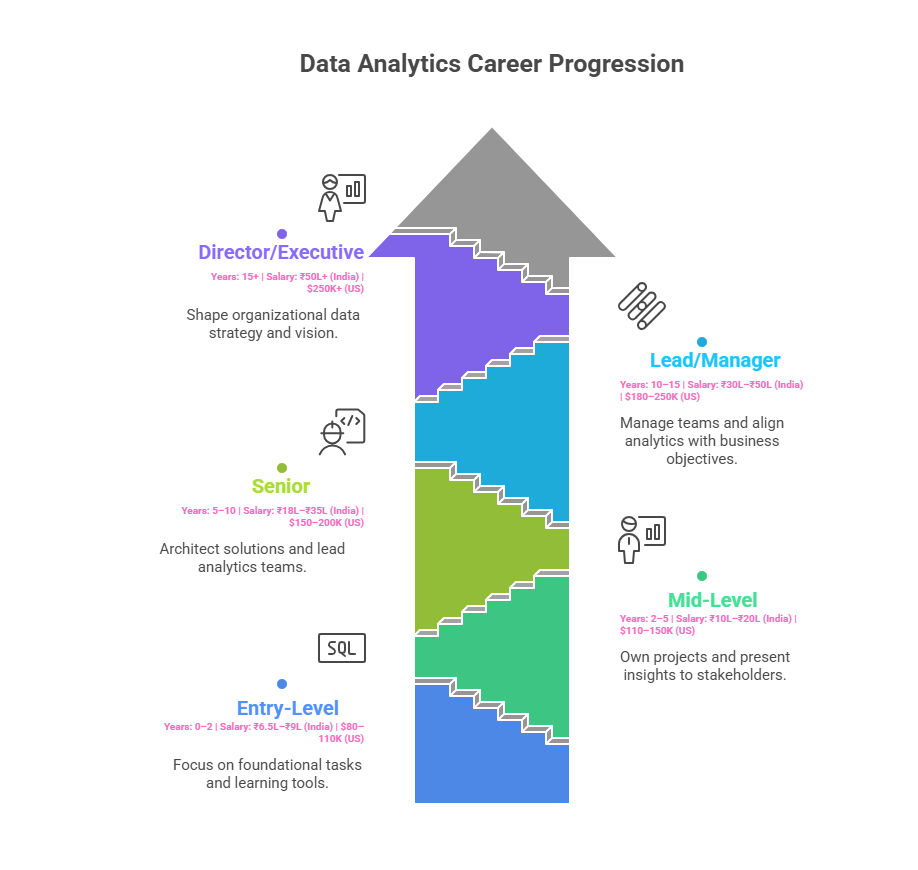
Entry-Level (0-2 Years)
Entry-level data analysts focus on foundational work under mentorship: writing basic SQL queries, creating simple dashboards, generating standard reports, and learning analytics tools and processes. Titles include Data Analyst, Junior Data Analyst, or Business Analyst.
This phase emphasizes learning business domain, understanding data sources, and developing fluency with core tools. Most time (60-70%) involves data extraction, cleaning, and basic visualization. Success requires attention to detail, curiosity about business problems, and ability to learn tools quickly.
Mid-Level (2-5 Years)
Mid-level analysts own projects end-to-end, from problem definition through dashboard deployment. They design complex analyses, present insights to stakeholders, lead projects with business impact, and mentor junior analysts informally. Titles include Data Analyst, Senior Data Analyst, or Analytics Consultant.
This inflection point represents shift from "executing assigned tasks" to "driving business outcomes." Mid-level analysts propose analytical approaches, challenge assumptions, collaborate cross-functionally, and begin specializing in particular domains or techniques.
Senior (5-10 Years)
Senior analysts architect analytics solutions at organizational scale, lead analytics teams, define standards and best practices, mentor junior analysts, and translate complex business problems into analytical strategies. Titles include Senior Data Analyst, Lead Analyst, or Analytics Architect.
Senior roles emphasize strategic thinking: anticipating future analytics needs, preventing technical debt, ensuring initiatives align with business strategy, and building analytics capabilities across the organization.
Lead/Manager (10-15 Years)
Analytics managers lead analytics teams, manage budgets, hire and develop talent, set team strategy, and align analytics with business objectives. They transition from individual contribution to leadership, focusing on team productivity, stakeholder management, and organizational impact.
Director/Executive (15+ Years)
Directors and Chief Analytics Officers shape organizational data strategy, set enterprise analytics vision, drive data culture, and ensure analytics becomes competitive advantage. These executives work closely with C-suite on strategic decisions.
Foundational Skills Development
Phase 1: Excel & Math Fundamentals (4-6 Weeks)
Excel remains foundational despite new tools. Mastering advanced Excel accelerates career and enables quick analysis.
Key Skills:
Key performance indicator: Quickly analyze datasets in Excel, create compelling visualizations, design interactive reports.
Phase 2: SQL & Databases (3-4 Weeks)
SQL is non-negotiable for data analytics. Most business data lives in databases; SQL enables direct access without engineering support.
Fundamentals (Weeks 1-2): SELECT statements, WHERE filtering, ORDER BY sorting, JOIN operations (INNER, LEFT, RIGHT). Query single and multiple tables.
Intermediate (Weeks 3-4): Aggregations (COUNT, SUM, GROUP BY, HAVING), subqueries, Common Table Expressions (CTEs), window functions (RANK, ROW_NUMBER, PARTITION BY).
Key performance indicator: Write complex SQL queries to extract analysis-ready datasets, optimize query performance, understand database concepts.
Phase 3: Business Intelligence Tools (3-4 Weeks)
Master one BI platform (Tableau or Power BI) to design compelling dashboards and reports.
Tableau Focus: Drag-and-drop interface, data connections, creating views, dashboards, interactivity, publishing, Tableau Server.
Power BI Focus: Power Query for data preparation, DAX for calculations, Power BI Desktop, service, creating reports and dashboards, sharing with stakeholders.
Key performance indicator: Design interactive dashboards that drive business decisions, optimize dashboard performance, teach others dashboard concepts.
Phase 4: Python/R & Statistics (4-6 Weeks)
Programming enables advanced analytics beyond BI tools.
Python Focus:
Statistical Concepts:
Key performance indicator: Perform exploratory data analysis using Python, conduct statistical tests correctly, interpret results for business stakeholders.
Phase 5: Advanced Analytics (3-4 Weeks)
Move beyond descriptive analysis to predictive insights.
Advanced Topics:
Key performance indicator: Build predictive models, forecast trends, design valid experiments, translate advanced analyses into business recommendations.
Learning Pathway & Implementation
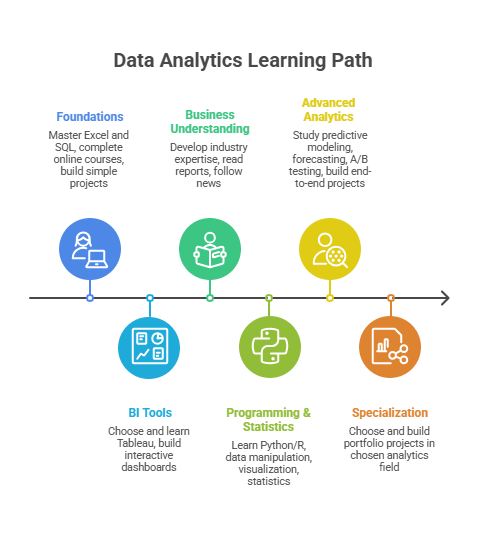
Phase 1: Foundations (4-6 Weeks)
Master Excel and SQL through dedicated study. Complete online courses (DataCamp, Coursera). Practice on real datasets. Build simple analysis projects.
Phase 2: BI Tools (3-4 Weeks)
Choose one BI platform (Tableau recommended for broader job market). Complete official tutorials. Build dashboards from public datasets. Practice interactivity and storytelling.
Phase 3: Business Understanding (Ongoing)
Understand industry-specific metrics, business models, competitive dynamics. Read industry reports. Follow business news. Build domain expertise in chosen industry.
Phase 4: Programming & Statistics (4-6 Weeks)
Learn Python or R basics. Practice data manipulation with Pandas. Create visualizations with Matplotlib/Seaborn. Study statistics fundamentals.
Phase 5: Advanced Analytics (3-4 Weeks)
Study predictive modeling, forecasting, A/B testing. Build models on Kaggle datasets. Practice end-to-end projects combining SQL, Python, and visualization.
Phase 6: Specialization (Ongoing)
Choose specialization based on interests: Product Analytics, Financial Analytics, BI, or Analytics Engineering. Build portfolio projects demonstrating specialized expertise.
Portfolio Strategy
Build 4-5 public GitHub/portfolio projects showing:
Each project should document business problem, analytical approach, key findings, and business recommendations.
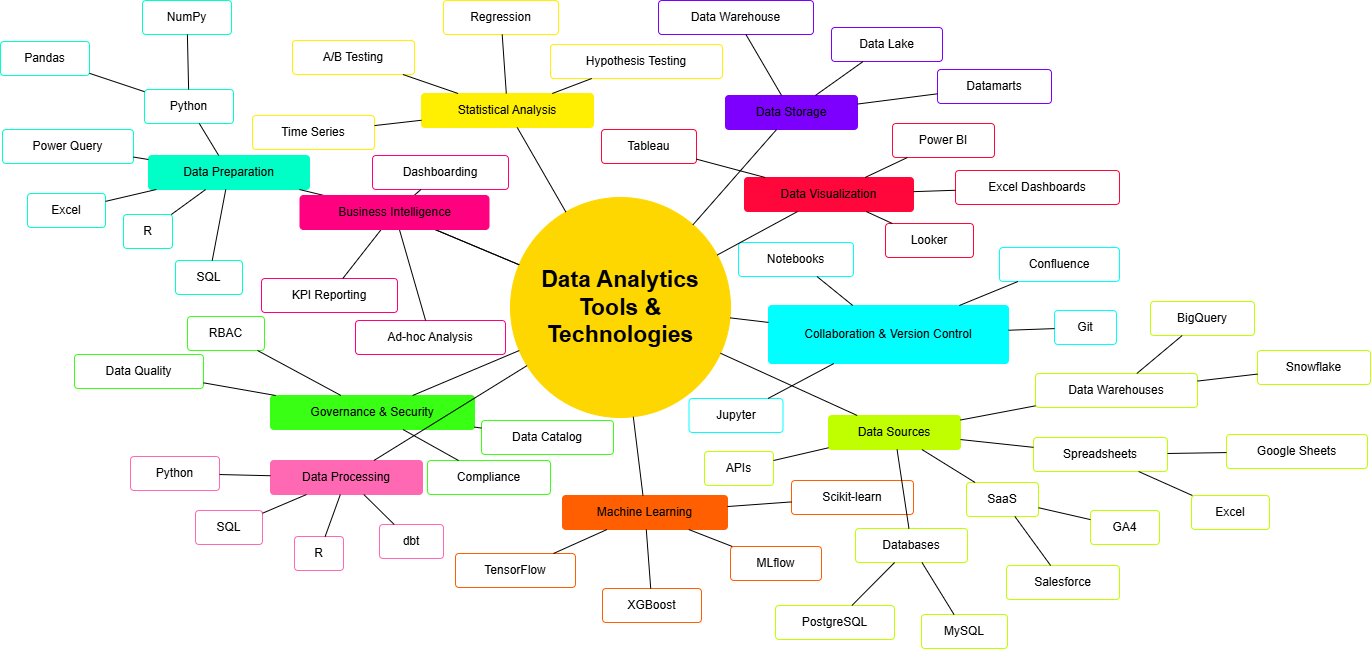
Technology Stack & Tools
BI & Dashboarding
Data Visualization
SQL & Databases
Programming Languages
Statistical Tools
Data Warehouses
Emerging Tools
Data Analytics Specializations
Business Intelligence Analyst
BI Analysts focus on enterprise reporting and dashboarding. They manage data warehouses, OLAP cubes, and BI platforms. They create standardized reports and dashboards for business users, ensure data consistency, and optimize BI infrastructure.
Product Analytics
Product Analysts analyze user behavior, measure product performance, and optimize user experience. They design A/B tests, build funnel analysis, track key metrics, and provide data-driven product recommendations. This specialization thrives in tech, SaaS, and e-commerce.
Financial Analytics
Financial Analysts build financial models, forecasts, and risk analyses. They focus on budgeting, revenue analysis, cost optimization, and financial planning. This specialization offers premium compensation in banking, fintech, and corporate finance.
Analytics Engineer
Analytics Engineers bridge data engineering and analytics, building data transformation pipelines using SQL and dbt. They design data models, create semantic layers, and enable self-service analytics. This emerging specialization combines technical depth with analytics acumen.
Skills Development Matrix
The skills progression shows how proficiency evolves across career levels:
Entry-Level Focus:
Mid-Level Development:
Senior Sophistication:
Leadership Vision:
Salary Expectations & Market Positioning
United States (2025-2026)
India (2025-2026)
India has emerged as a major analytics hub with rapidly growing demand:
Key Cities:
Multinational companies pay 30-50% above local IT company rates. Remote work for US/European companies offers 50-100% premium.
Singapore (2025-2026)
Singapore positions itself as Southeast Asia's premium market:
Singapore's 40-60% premium over other ASEAN nations reflects its position as regional financial and tech hub.
Global Geographic Comparison (Mid-Level, 3-5 Years)
North America:
Europe:
Asia-Pacific:
Geographic Arbitrage Strategy
Many successful Asian analysts pursue this trajectory:
Future Trajectory & Emerging Trends
Real-Time Analytics
Organizations increasingly demand real-time dashboards and streaming analytics. Analysts should familiarize themselves with real-time data platforms and streaming tools.
AI/ML Integration
Generative AI is automating routine analytics tasks. Analysts who leverage AI tools (ChatGPT, GitHub Copilot, Claude) for code generation, documentation, and insights dramatically increase productivity.
Advanced Analytics & Prediction
Beyond descriptive analytics, organizations increasingly demand predictive modeling, forecasting, and prescriptive analytics. Analysts combining strong analytical skills with statistical knowledge will be highly valued.
Data Governance & Privacy
As regulatory scrutiny increases (GDPR, CCPA, local regulations), analytics professionals prioritizing data governance and privacy will command premiums.
Self-Service BI
Self-service analytics platforms empower business users. Successful analysts will focus on enabling self-service through semantic layers and data governance rather than creating every dashboard themselves.
Strategic Recommendations
For Aspiring Data Analysts
For Organizations Hiring
Conclusion
Data analytics has matured from a support function into a strategic business capability. The field offers attractive career progression, competitive compensation globally, and meaningful work solving business problems. Success requires continuous learning, technical execution, business acumen, and strong communication skills.
The future of data analytics emphasizes sophisticated analysis, real-time insights, responsible data practices, and organizational impact. Analysts combining technical depth with strategic business thinking will thrive in this evolving landscape.
Asia's analytics ecosystem is rapidly maturing, offering significant opportunities for talent development and career growth. Geographic arbitrage opportunities remain substantial for ambitious professionals willing to develop expertise and navigate international opportunities strategically.
This roadmap provides the foundational framework. Individual choices—specialization selection, geographic strategy, company selection, and continuous learning—ultimately determine career trajectory within this dynamic and rewarding field.